Purpose
Compare and Contrast charts, more commonly known as Venn Diagrams, are used to highlight similarities and differences between two ideas, objects, topics, or perspectives. They are most often used with indirect instruction techniques to help students discover the information on their own without direct influence of the teacher. Students can better develop classification skills and determine connections between multiple ideas.
Procedures
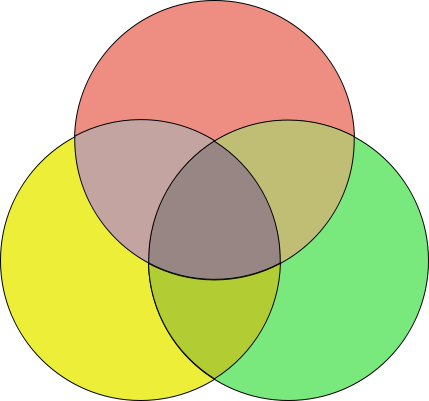
When presenting students with Venn Diagrams at the secondary level, the students are typically aware of the compare and contrast techniques associated with the diagrams. It is best for the teacher to first model the amount of detail required for the comparisons and how in-depth each component of the compare and contrast should be. The graphic organizers themselves are generally displayed as either written paragraphs or in the form of a chart. Written paragraphs can be presented in the form of a Venn Diagram, provided there is enough space to contain the information needed. The traditional form of a Venn Diagram depicts two overlapping circles to compare and contrast two different ideas. However, variations of this can include three interlocking circles to compare three different ideas with each other, as well as three circles connected in a line to compare and contrast one central idea with two outlying ideas.
Example
Below are two of the most common types of Compare and Contrast charts used.
References: Central High School, 2012; McLaughlin, 2010
